

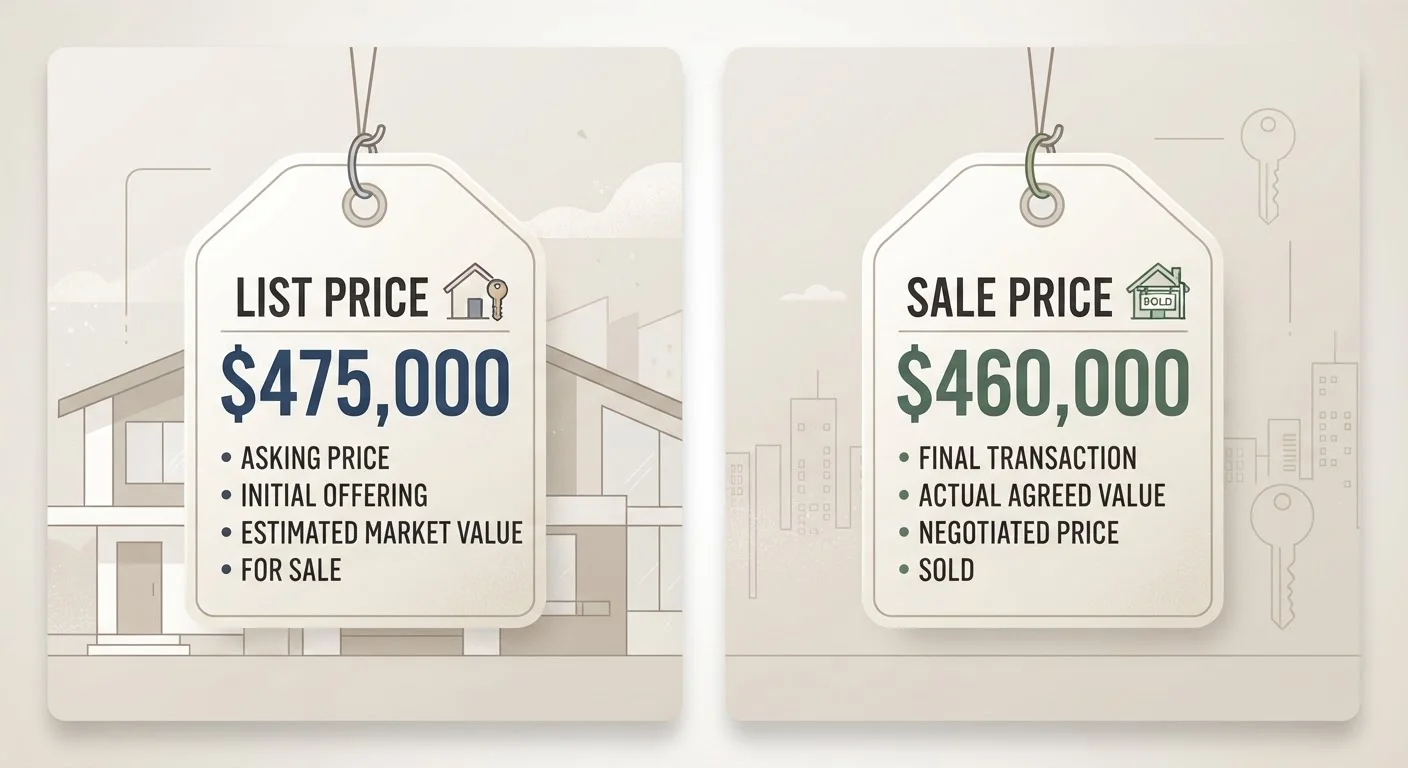
Why the Gap Exists in the First Place
Every home listed for sale carries an asking price - what the seller hopes to receive. But the price printed on the listing is rarely the price that appears on the final closing documents. The spread between those two numbers is called the list-to-sale price gap, and understanding it can tell you a great deal about the health of a local housing market.
This gap exists because real estate is a negotiation. Sellers set asking prices based on their expectations, comparable sales data, and sometimes wishful thinking. Buyers respond with offers shaped by their own research, financing constraints, and appetite for competition. Where those two parties meet - or fail to - is reflected in the final sale price.
Several forces widen or narrow this gap: how many homes are available relative to demand, how long a property has been sitting without an offer, and how accurately the seller priced the home to begin with. When inventory is low and buyers are plentiful, the gap shrinks - sometimes flipping negative, meaning homes sell above asking. When supply swells or demand cools, the gap widens as sellers accept less than they originally sought.
What a Widening or Narrowing Gap Signals
Think of the list-to-sale spread as a market thermometer. A narrow or negative gap - homes routinely selling at or over asking - points to strong buyer competition and limited inventory. A widening gap suggests the opposite: sellers are being asked to adjust their expectations because buyers have more options and less urgency.
~98%-103%
Typical sale-to-list ratio range across US markets
National Association of Realtors data has historically shown most metro markets oscillate in this band depending on inventory conditions.
1%-3%
Average negotiation discount in a balanced market
In markets with roughly equal supply and demand, buyers typically secure modest discounts from original asking prices.
17+ days
Median days on market when larger discounts appear
Industry observations suggest listings passing the two-week mark without an offer become more susceptible to price reductions and below-ask closings.
This is why real estate professionals track the ratio across dozens of transactions rather than reading too much into any single sale. One home selling $20,000 under asking could reflect a motivated seller, a property with disclosed issues, or simply a listing that was mispriced from day one. But when most homes in a neighborhood close 4%-6% below asking over several months, that's a pattern worth paying attention to.
The gap also interacts with another key metric: days on market. Homes that linger tend to accumulate larger discounts, because extended exposure signals to buyers that they have negotiating leverage. If you notice both a widening list-to-sale gap and rising days on market in an area, those two signals reinforce each other as indicators of a softening market. For a deeper look at how these and other figures fit together, see our guide to reading a housing market report.
How Sellers' Pricing Choices Shape the Gap
A common seller instinct is to list high and negotiate down. The reasoning seems logical: start with room to give ground. But research on housing behavior consistently suggests this strategy often backfires. Overpriced listings tend to attract fewer showings, sit longer, and ultimately close at a steeper discount than homes priced at or just below market value from the start.
“The listing price is a seller's opening statement, not a statement of value. Markets price homes - sellers just make suggestions.”
— Real estate appraisal and valuation literature, Core principle in residential property valuation practice
Sellers who price accurately - even slightly below what they believe they could get - often generate more offers and stronger final terms. The gap, in those cases, may actually shrink because competitive bidding pushes the sale price up toward or past the asking price.
This dynamic helps explain why the list-to-sale ratio is as much a measure of seller pricing behavior as it is of buyer demand. Understanding what type of market you're operating in is essential context before drawing conclusions from any single ratio.
Using This Data as a Buyer or Seller
For buyers, a widening list-to-sale gap in a target neighborhood is meaningful permission - it suggests that offering below asking is reasonable and may succeed. It's also worth tracking whether the gap has been growing over recent months, which could indicate the market is continuing to shift in buyers' favor.
For sellers, a narrowing gap in comparable sales should inform how they approach pricing. If nearby homes are closing within 1% of asking, there's less reason to inflate the list price as a negotiating buffer. Pricing at market value is more likely to generate the clean, competitive offers that lead to the strongest final outcome.
One important caution: the list-to-sale ratio is a lagging indicator. It reflects transactions that already closed - sometimes 30 to 60 days after an offer was accepted. For signals about where the market is heading rather than where it's been, consider pairing this metric with forward-looking data. Our article on indicators worth watching when timing a housing decision covers those leading data points in detail.
Also keep in mind that aggregate metro-area figures can obscure meaningful variation. Condos and single-family homes, for instance, often show different gap patterns even within the same zip code - a nuance worth exploring if you're comparing property types.
Frequently Asked Questions
It generally means demand exceeds supply in that area, prompting buyers to compete with offers over the list price. This is typical in seller's markets where inventory is tight. It doesn't necessarily mean every home will sell over asking - condition, location, and pricing accuracy all matter.
It depends heavily on local market conditions. In a balanced market, a 1%-3% negotiation below asking is common. Discounts of 5% or more may indicate softer demand, an overpriced listing, or a property with issues. Context - including how long the home sat on the market - matters as much as the number itself.
Local multiple listing service (MLS) data, published through real estate agents, is the most reliable source. Some real estate data websites also publish aggregated sale-to-list ratios by zip code or metro area. A local agent can pull recent comparable sales showing both figures.
Not always. Sometimes a seller deliberately lists high to leave room for negotiation, and a discount from that inflated price still results in a satisfactory outcome. Other times, a concession on price comes paired with other terms - like a faster close or waived contingencies - that benefit the seller. The ratio alone doesn't capture the full deal.
Yes, significantly. Even within one metro area, different neighborhoods, price tiers, and property types can show very different ratios. For example, condos and single-family homes often follow distinct supply-and-demand dynamics even on the same street.
The content on this site is for informational purposes only and is not a substitute for professional advice. Always consult a qualified professional for guidance specific to your situation.