

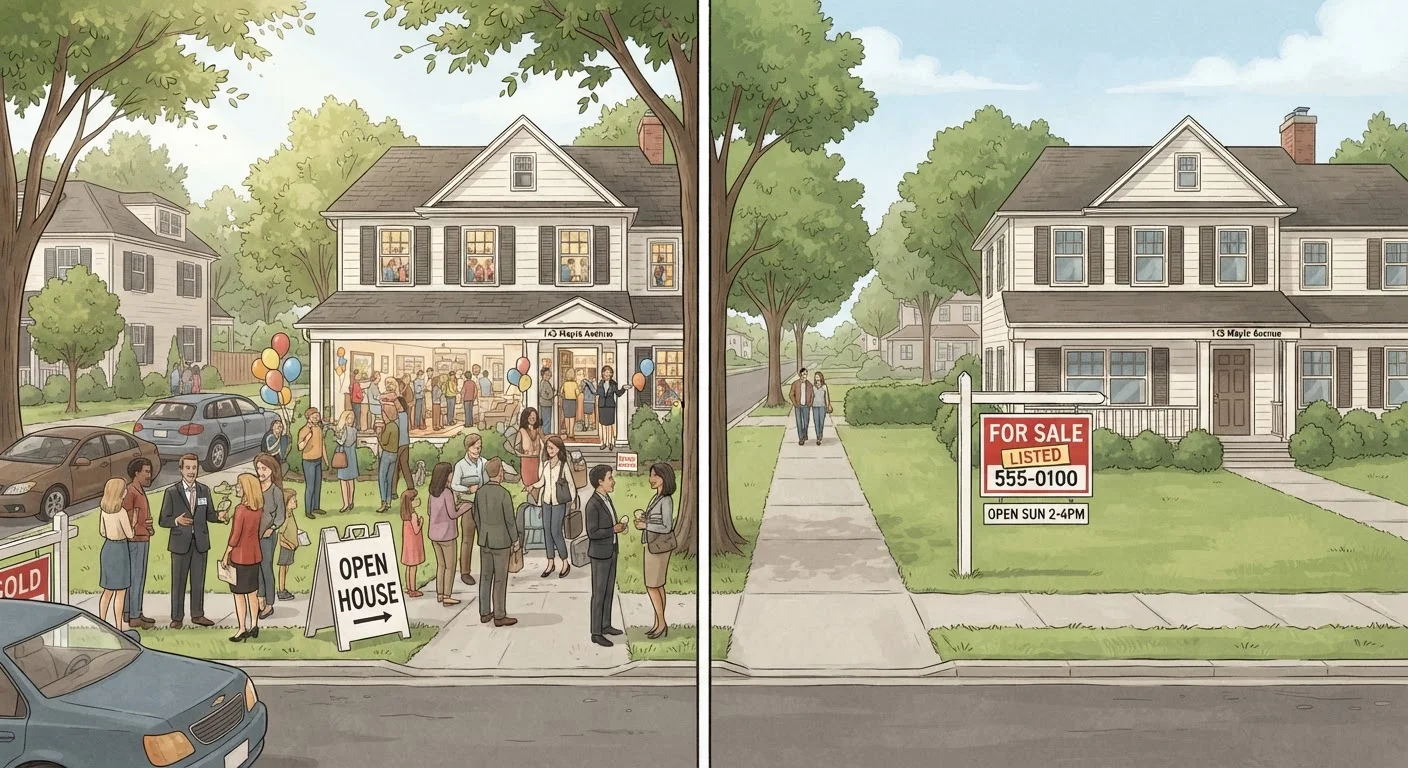
The Three Market States at a Glance
Every housing market - whether national or hyper-local - exists in one of three conditions at any given time: a seller's market, a buyer's market, or a balanced market. These labels describe the relationship between supply (how many homes are available) and demand (how many people want to buy). That ratio determines which side of the transaction holds more leverage.
| Seller's market inventory threshold | Under 4-5 months of supply (National Association of Realtors general guidance) |
| Buyer's market inventory threshold | Over 6 months of supply (National Association of Realtors general guidance) |
| Balanced market range | Approximately 5-6 months of supply (Commonly cited industry benchmark) |
| Key metric to watch | Days on market (DOM) |
| Second metric to watch | List-to-sale price ratio |
| Market conditions vary by | City, neighborhood, and price tier |
Understanding which type of market you're operating in shapes nearly every decision you'll make - what price to list at, how aggressive to be with an offer, or whether to wait at all. For a fuller picture of what drives these conditions in the first place, see how the housing market works.
Seller's Market: When Demand Outpaces Supply
A seller's market occurs when there are more buyers competing for homes than there are homes available. Inventory is low, homes sell quickly - often within days - and sellers frequently receive multiple offers, sometimes above the asking price.
Key signals of a seller's market include:
- Homes selling in under 30 days on average
- List-to-sale price ratios at or above 100%
- Low months of supply (typically under 4-5 months)
- Few contingencies accepted by sellers
For buyers: Competition is fierce. You may need to act fast, offer above asking price, or waive certain contingencies - though waiving inspection contingencies carries real risk and should be considered carefully. Patience and pre-approval are essential.
For sellers: Conditions favor you. Homes sell faster and often at stronger prices. That said, overpricing still backfires - even motivated buyers walk away from listings that are clearly disconnected from comparable sales.
Buyer's Market: When Supply Exceeds Demand
A buyer's market flips the dynamic. There are more homes available than there are buyers ready to purchase them. Inventory climbs, homes sit on the market longer, and sellers often need to reduce prices or offer concessions to attract offers.
Key signals of a buyer's market include:
- Homes sitting on the market for 60+ days
- Frequent price reductions on active listings
- Months of supply above 6 months
- Sellers offering closing cost assistance or repair credits
For buyers: You have room to negotiate. Offers below list price are more common, and sellers are more likely to accept contingencies and accommodate timelines. Don't mistake opportunity for urgency - a buyer's market rewards deliberate decision-making.
For sellers: Pricing accurately from the start matters more than ever. Overpriced homes in a buyer's market tend to linger, which can signal problems to future buyers even if the price eventually drops. Presentation, condition, and realistic expectations become critical.
Seller's Market
A housing market condition where buyer demand exceeds available inventory, giving sellers more pricing power and negotiating leverage.
Buyer's Market
A housing market condition where the number of available homes exceeds buyer demand, giving buyers more room to negotiate on price and terms.
Balanced Market
A state of equilibrium between supply and demand in housing, where neither buyers nor sellers hold a clear advantage. Often approximated by 5-6 months of available inventory.
Months of Supply
A measure of how long the current inventory of homes would last at the current pace of sales if no new listings were added. It is one of the most widely used indicators of market type.
Days on Market (DOM)
The number of days a home is listed for sale before a contract is accepted. Lower DOM figures suggest stronger demand; higher figures suggest weaker demand or overpricing.
List-to-Sale Price Ratio
The percentage of the final sale price relative to the original list price. A ratio above 100% means homes sold above asking; below 100% means they sold at a discount.
Balanced Market: Neither Side Has the Edge
A balanced market - sometimes called a neutral market - exists when supply and demand are roughly in equilibrium. Homes sell at a measured pace, prices remain relatively stable, and neither buyers nor sellers hold a decisive advantage. Economists and housing analysts generally consider roughly 5-6 months of inventory supply as the benchmark for balance, though this can vary by region and price tier.
In a balanced market, negotiations tend to be more straightforward. Contingencies are commonly accepted, back-and-forth on price is normal, and homes sell closer to their list price without the frenzy of a seller's market or the stagnation of a buyer's market.
Balanced markets are less dramatic - but they're often the most transparent environment to make a clear-headed housing decision. For guidance on reading the data signals that indicate which market type you're in, see how to read a housing market report.
Keep in mind that market conditions vary significantly by geography. A city-wide buyer's market can coexist with a seller's market in a specific zip code or price range. Always evaluate conditions at the local level - and consider which indicators are worth watching before making a timing decision.
The content on this site is for informational purposes only and is not a substitute for professional advice. Always consult a qualified professional for guidance specific to your situation.