

How the Number Is Calculated
The math behind months of supply is straightforward. Take the total number of homes currently listed for sale in a given area, then divide by the average number of homes sold per month over a recent period - typically the past three to twelve months. The result tells you, in theory, how many months it would take to clear the existing inventory at the current sales pace.
For example, if a market has 600 active listings and averages 200 sales per month, that produces three months of supply - a figure that strongly favors sellers. If that same market had 1,400 listings with the same sales pace, it would show seven months of supply, leaning toward buyers.
For a broader look at how this figure fits alongside other housing data points, see our guide to reading a housing market report without getting lost in the numbers.
6 months
Traditional balanced market threshold
The six-month benchmark has long been used by real estate professionals and industry associations as a general dividing line between buyer and seller market conditions.
~3 months
US existing home supply, recent years
The National Association of Realtors has reported months of supply for existing homes hovering in the 3-4 month range during periods of constrained inventory, reflecting persistently tight conditions in many markets.
Varies widely
Supply range across US metro areas
Local MLS data regularly shows months of supply ranging from under two months in high-demand metros to over ten months in slower regional markets, highlighting the importance of local rather than national figures.
What the Benchmarks Actually Mean
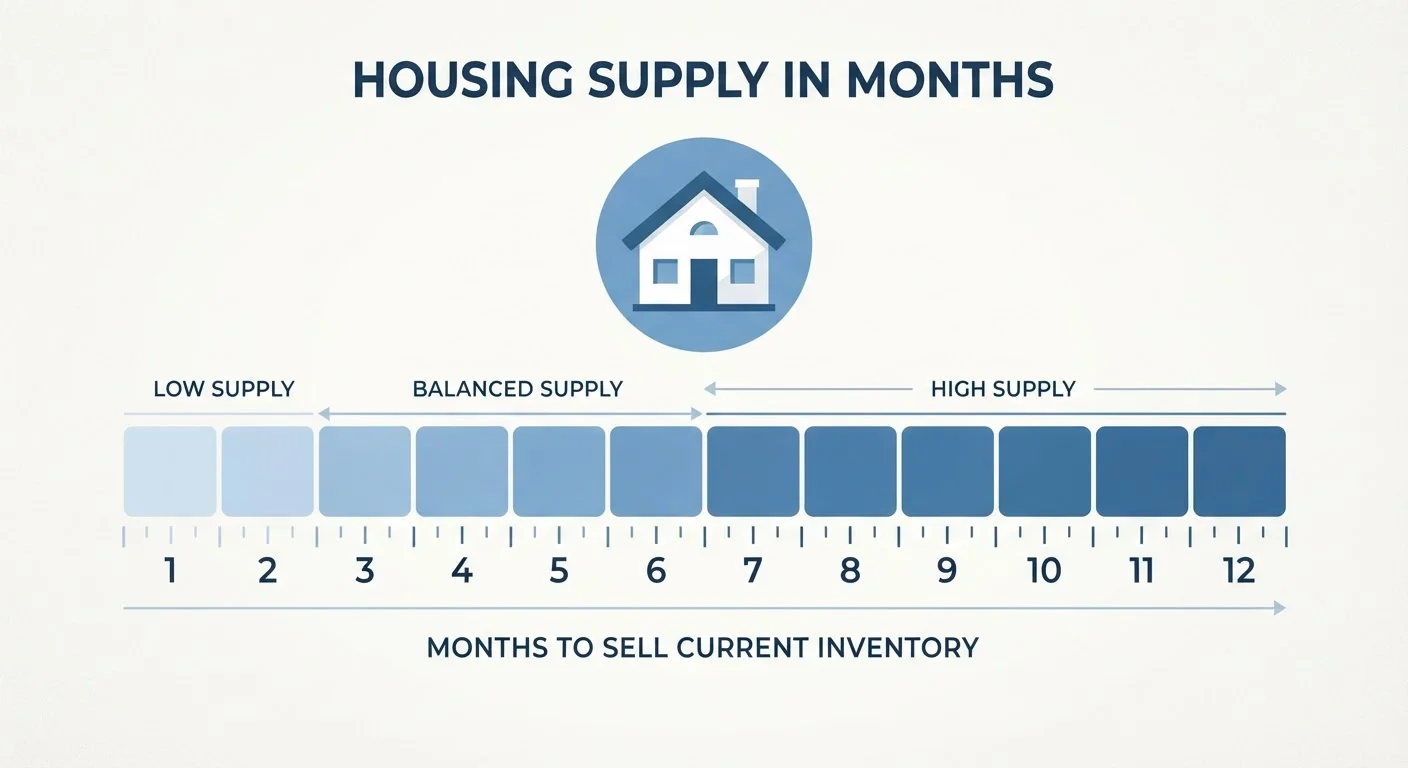
The six-month benchmark is a rule of thumb, not a law. It emerged from historical patterns suggesting that at six months of supply, neither buyers nor sellers hold a decisive structural advantage - prices tend to be relatively stable and negotiation is more mutual.
- Under 4 months: A strong seller's market. Homes often sell quickly, sometimes above list price, with limited room to negotiate on repairs or contingencies.
- 4-6 months: A moderately competitive market. Conditions are more balanced, though still often tilted slightly toward sellers in most US metros.
- 6 months: The traditional balanced-market threshold. Prices tend to be stable and buyers have meaningful leverage.
- Over 6 months: A buyer's market. Sellers may need to reduce prices or offer concessions to attract offers. Homes sit on the market longer.
It is worth noting that these ranges are not rigid. A market at 5.5 months can feel like a seller's market in one region and a buyer's market in another, depending on local norms and price segments.
A first-time buyer is house-hunting in a suburb where the local MLS reports 2.1 months of supply.
A homeowner in a mid-sized city is preparing to list and notices months of supply has climbed from 3.5 to 7.2 over the past year.
A buyer reads that the national months of supply is 4.5 months but finds their target neighborhood shows 8 months.
Why Local Context Is Everything
National months of supply figures make headlines, but they are averages built from thousands of individual local markets - and averages can mask enormous variation. A national reading of five months might reflect a mix of markets with two months and markets with nine months, none of which describes your specific neighborhood.
Price tiers add another layer. Even within a single city, the months of supply for entry-level homes might be two months while luxury properties sit at eleven months. Treating a citywide number as representative of every segment can lead buyers and sellers to misread their actual position.
This is why local data almost always tells a different story than national headlines. When evaluating months of supply, request figures from a local agent or MLS that are specific to your target zip code and price range.
How to Use This Metric When Making a Housing Decision
Months of supply is most useful when read as part of a pattern over time rather than as a single snapshot. A market moving from eight months to five months over six months signals tightening conditions - sellers are gaining leverage even if the absolute number still looks buyer-friendly. The direction of change matters as much as the level.
Pair it with related indicators for a fuller picture. Days on market tells you how quickly homes are actually selling. The list-to-sale price ratio shows whether sellers are getting their asking price. Understanding how overall inventory levels move helps explain why months of supply shifts in the first place.
Also be aware of seasonal noise. Inventory typically rises in spring and falls in winter across most US markets, which can cause months of supply to fluctuate without reflecting a structural shift in demand. Seasonality shapes listing and sales patterns throughout the year and should be factored into any month-to-month comparison.
For those trying to time a major housing decision, months of supply is one of several indicators worth monitoring together rather than relying on any single data point.
Frequently Asked Questions
Generally, a months of supply figure above six is considered favorable for buyers because it means more homes are available relative to demand. Buyers tend to have more negotiating room and face less competition when supply is higher. That said, what counts as "buyer-friendly" varies by market.
Low months of supply - typically below four - often puts upward pressure on home prices because demand outpaces available inventory. Sellers can receive multiple offers and may accept bids above asking price. However, low supply alone does not guarantee price increases; mortgage rates and local economic conditions also play a role.
Most local Multiple Listing Services (MLS) and real estate associations publish months of supply figures monthly. National organizations such as the National Association of Realtors also release monthly housing supply data as part of their existing and pending home sales reports.
No - months of supply is highly localized. A market in one city can show two months of supply while a market in another shows eight, even within the same state. Always seek data specific to the metro area, city, or zip code you are researching.
Yes. A surge in new listings or a sudden drop in buyer activity can shift the figure meaningfully within one or two monthly reporting cycles. Seasonality is a common driver - spring typically brings more listings, which can temporarily raise supply figures even in tight markets.
The content on this site is for informational purposes only and is not a substitute for professional advice. Always consult a qualified professional for guidance specific to your situation.